Adverse Impact Reports
Adverse Impact Analysis reports display the applicant, hire, base group, promotion from/within and termination data that are in the Adverse Impact table of the software. The report uses a statistical test to determine if adverse impact exists in the hiring, promotion or termination rates of one gender or race/ethnicity over another. The Complete AAP defaults the use of The Fisher’s Exact Test, which was developed to more accurately compare the selection ratios of minorities to whites, and females to males in groups. The default settings in The Complete AAP deem a reported number of greater than .05 as passing the Fisher's Exact test. Though The Fisher’s Exact test can be calculated in a variety of different ways, a number of .05 or less is considered by the OFCCP to be a statistically significant indication that the difference in selection rates occurred by something other than chance.
Our current Adverse Impact Report default settings include showing only Fisher's Exact and allowing the software to use the "favored" group as the base group for comparison. The favored group may change from job group to job group. It has been our experience that the OFCCP does not question the use of allowing the software to determine the favored group but they may question if you do not use this method.
What should you look for?
• Review each report to identify areas of statistical adverse impact. Statistical adverse impact is indicated by a “Yes” in the Statistically Significant column.
• If “N/A” appears in the Statistically Significant column, the software cannot conduct a valid analysis due to one or more factors.
Applicant Flow
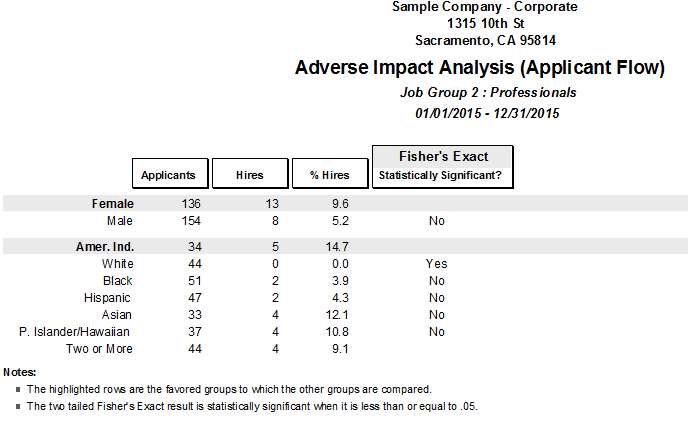
The Adverse Impact Analysis (Applicant Flow) report compares the number of hires to the number of applicants in each job group. The percentage of hires is calculated by dividing the number of hires by the number of applicants. The difference in the percentage of hires between males versus females, and whites versus minorities is run through a statistical test to determine if it is statistically significant.
What should you look for?
• Review all of your totals to ensure that accurate data were used in the analysis.
• Review the applicants in the groups with adverse impact to determine the nondiscriminatory reasons why non-favored groups were not hired at a statistically similar rate to that of favored groups.
Promotions (From/Within)
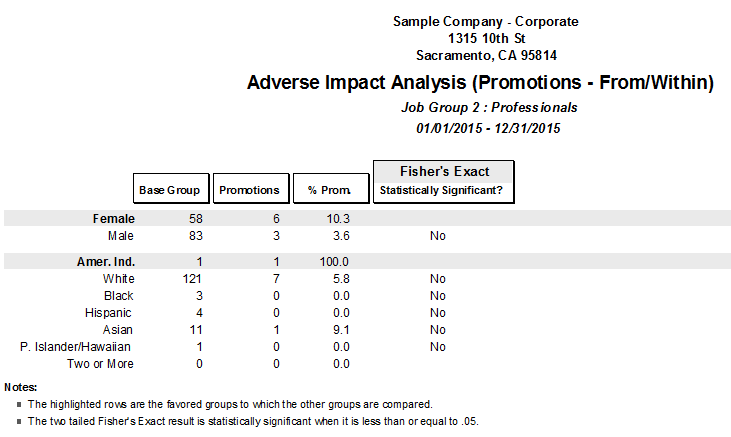
The Adverse Impact Analysis (Promotions – From/Within) report calculates the percentage of promotions by dividing the number of promotions by the base group.
What should you look for?
• Review all of your totals to ensure that accurate data were used in the analysis.
• Analyze the groups with adverse impact to determine the nondiscriminatory reasons why non-favored groups were not promoted at a rate similar to that of favored groups.
Terminations
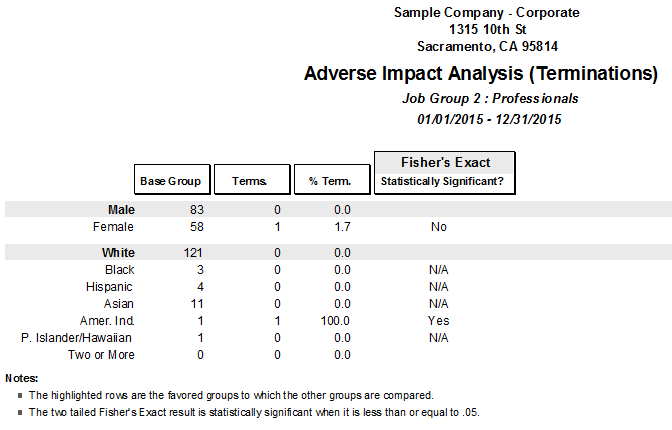
The Adverse Impact Analysis (Terminations) report calculates the percentage of terminations by dividing the number of terminations by the base group.
What should I look for?
• Review all of your totals to ensure that accurate data were used in the analysis.
• Analyze the groups with adverse impact to determine nondiscriminatory reasons why non-favored groups were terminated at a greater rate than favored groups.
See Also
Adverse Impact Tests
Adverse Impact Window
Applicant Or Promotion
Internet Applicant Guidelines
Publish Your Reports
Report Options - Adverse Impact Report
Understanding Your Reports
© Copyright Yocom & McKee, Inc.


